Lead GenerationAugust 3, 2026By Yash
Google Ads vs. Meta Ads for Small Business: Which Wins by Industry
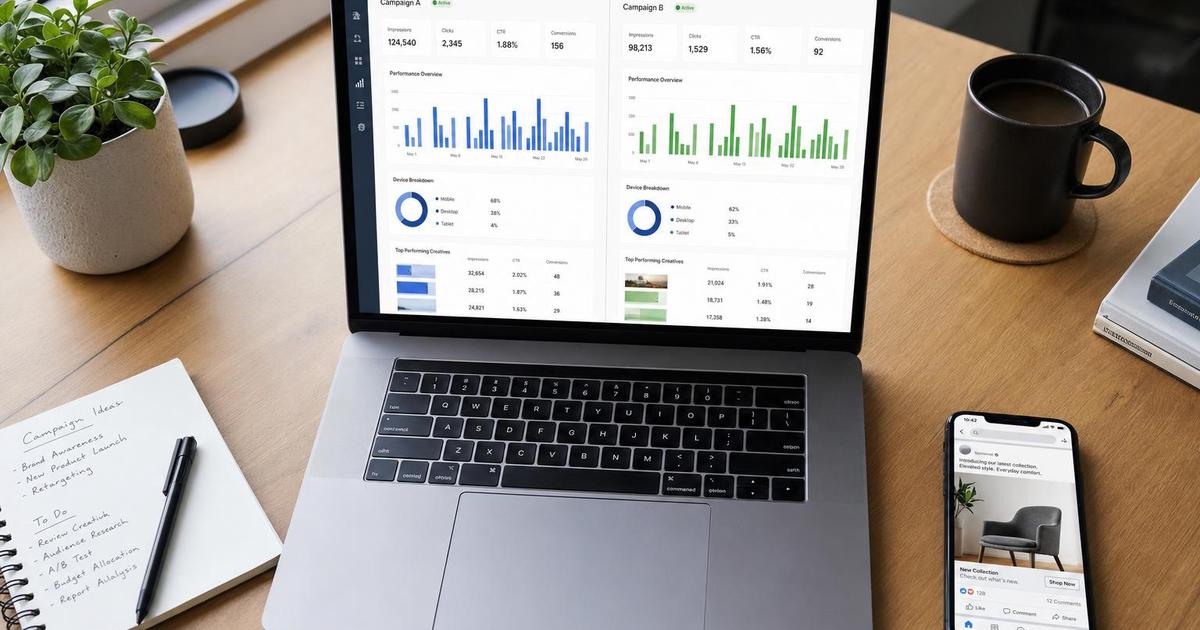
We've already covered what a lead costs on each platform — Meta Ads runs cheaper per lead than Google Ads almost across the board. But cost per lead isn't the same question as which platform actually wins for your business, and the honest answer depends more on your industry and what triggers someone to buy than on either platform's average price tag.
This guide covers which platform converts better by industry, why Meta's own reported return might not tell the full story, and how to tell where your business actually sits on the spectrum between the two.
Key Takeaways
- Conversion rate flips by industry and platform: Real Estate converts at 9.53% on Meta versus 3.70% on Google, while Physicians & Surgeons convert at 12.43% on Google versus just 4.51% on Meta.1,2
- Meta is projected to overtake Google in global digital ad revenue for the first time in 2026 — $243.46B versus $239.54B — growing at 24.1% versus Google's steady 11.9%.3
- Meta reports $4.52 average ROAS on its Advantage+ Shopping campaigns, but independent research across 640 incrementality experiments found Advantage+ underperformed manual campaigns on true incremental lift for 58% of brands studied.4,5
- 90%+ of small businesses now advertise on Facebook (up from 76% in 2024), and 56% run social ads versus 45% running search ads.6
- Neither platform "wins" outright — the real answer is a spectrum from high-intent/urgent-need (Google) to visually-driven/discovery-led (Meta), and most small businesses sit somewhere in the middle.
In this guide:
- Why this isn't really a cost question
- Which industries convert better on each platform
- The Advantage+ number you shouldn't take at face value
- Where each platform is heading
- Which platform is right for your business
- FAQ
Why This Isn't Really a Cost Question
Google Ads and Meta Ads solve fundamentally different problems, and that difference matters more than either platform's price tag. Google Ads captures existing demand — someone already searching for what you sell, at the exact moment they want it. Meta Ads creates demand — someone scrolling with no active intent, who has to be shown something they didn't know they wanted yet.
That distinction is why comparing them purely on cost per lead misses the point. A cheaper lead that came from an interrupted scroll isn't automatically a better lead than a more expensive one that came from an active search — they're different products at different stages of a buyer's decision, and the platform that "wins" depends entirely on which stage your business needs to reach.
Which Industries Convert Better on Each Platform
The clearest evidence for the intent-versus-discovery framework shows up when you compare conversion rate — not cost — by industry, on matched categories from each platform's own benchmark data.
The pattern lines up with what you'd expect from the intent-versus-discovery split. Real Estate and Restaurants & Food — both visually-driven, browsing-friendly categories — convert better on Meta. Physicians & Surgeons — a need-driven category where people search when something's actually wrong — converts better on Google.1,2 The gap isn't small either: Restaurants & Food convert more than twice as well on Meta (18.25%) as on Google (8.05%) for the same general category.
That said, this comparison rests on one publisher's benchmark data across two separate reports — the industry-standard source for both platforms, but worth knowing it's a single point of reference rather than cross-verified by a second independent benchmark provider. Worth noting too: the Meta figures above come from a September 2025 report, roughly eleven months old at the time of writing, versus the Google figures from a November 2025 release — so treat the Meta side as the most recent available, not necessarily as fresh as the Google numbers.

The Advantage+ Number You Shouldn't Take at Face Value
Meta's own reporting on its AI-driven Advantage+ Shopping campaigns claims a $4.52 average ROAS — 22% higher than accounts not using it.4 Two independent studies, using different methodologies and different datasets, both suggest that number tells a less complete story than it sounds.
An analysis of 640 Meta incrementality experiments found that Advantage+ campaigns underperformed manually-built campaigns on true incremental lift for 58% of brands studied, once the researchers isolated genuinely new demand from demand the business would have captured anyway.5 Separately, an analysis of 55,661 Meta campaigns found new-customer acquisition cost through Advantage+ rose 105% — from $257 to $528 — over a 12-month window, even as Meta's self-reported ROAS held flat near $4.52 the entire time.7
Unique insight: the studies behind this gap skew toward larger advertisers than most small businesses — one dataset's average participant spends $14M a year on Meta. That doesn't make the finding irrelevant at small-business scale; if anything, it's a warning sign in the opposite direction. Larger advertisers have the budget and data volume to run their own incrementality tests and catch this gap. Most small businesses don't, which means they're more likely to trust the dashboard ROAS at face value precisely because they lack the resources to check it.
How AI-Driven Campaign Types Change the Calculus
Both platforms have shifted hard toward automated, AI-managed campaign types in the last two years — Google's Performance Max on one side, Meta's Advantage+ on the other — and that shift changes how the Google-vs-Meta question actually plays out in practice.
One account-level analysis of 247 advertiser accounts spending a combined $18.7 million over roughly 18 months found Performance Max outperforming standalone Search campaigns on average — a 5.3% conversion rate and $58 cost-per-acquisition for Performance Max, versus 3.8% and $79 for Search alone. Performance Max won outright for 58% of accounts studied, Search won for 42%, and running both together was the best setup for 73% of accounts.8 That's a single proprietary analysis rather than an industry-wide benchmark, so treat the exact numbers as directional rather than a guarantee for your account — but the "both together beats either alone" finding lines up with the broader pattern in this post: platforms increasingly reward businesses that don't force an either-or choice.
The practical shift for a small business: less time should go into manually building and tweaking individual ad sets, and more into feeding these AI systems better inputs — cleaner conversion tracking, tighter audience signals, and creative that actually differentiates rather than blends in. The platforms have automated the bidding; they haven't automated the judgment about what to bid on or how to tell if the automation is actually working, which is exactly the gap the Advantage+ data above illustrates.
Where Each Platform Is Heading
Small-business platform adoption has shifted meaningfully in the last two years. Facebook usage among small businesses climbed from 76% in 2024 to 90%+ in 2026, and Instagram rose from 63% to 74% over the same window.6 Today, 56% of small businesses run social ads versus 45% running search ads — a real shift in where marketing budgets are going.6
That local shift mirrors a larger one: Meta is projected to overtake Google in worldwide digital ad revenue for the first time in 2026, at $243.46B (26.8% share) versus Google's $239.54B (26.4% share) — with Meta's growth rate accelerating to 24.1% versus Google's steadier 11.9%.3 Part of that growth reflects how much Meta has rebuilt its targeting infrastructure since Apple's App Tracking Transparency changes, which Meta's own CFO estimated would cost the company roughly $10 billion in 2022 alone.9 Modeled conversions and server-side tracking have closed much of that gap since, though not entirely — which is one more reason to treat any single platform's self-reported performance metric with some skepticism rather than full trust.
Which Platform Is Right for Your Business
Use these three questions to place your business on the intent-versus-discovery spectrum, rather than picking a platform by habit or which one a competitor uses:
- Does your customer already know they want this, or do they need to be shown? Emergency, need-driven, or actively-researched purchases (legal, home repair, healthcare, B2B services) lean toward Google. Visually appealing, lifestyle, or impulse-friendly purchases (restaurants, beauty, home decor, local retail) lean toward Meta.
- How considered is the purchase? High-consideration decisions where buyers compare options tend to favor Google's search-intent signal. Lower-friction decisions favor Meta's visual discovery.
- Are you validating a new offer or scaling a proven one? Meta is often the stronger channel for building initial awareness of something new; Google tends to capture demand once that awareness already exists — which is why running both, in sequence, frequently outperforms picking just one.

Most small business owners can't cleanly self-diagnose where they sit on this spectrum, and fewer still have the time to manage both platforms' increasingly automated bidding systems — including checking whether a reported ROAS number like Advantage+'s actually reflects new business, or just demand you'd have captured anyway. That's a real, ongoing management job, not a one-time setup task.
Get a Media Buying Plan Built Around Where Your Customers Actually Are
We manage live Google Ads and Meta Ads accounts for clients across both platforms, and we build the plan around your actual buyer behavior — not a default 50/50 split or whichever platform's sales rep called first. Talk to a growth strategist if you want an honest read on which platform (or mix) fits your business, including a second opinion on whether your reported ROAS is telling you the real story.
Frequently Asked Questions
Is Google Ads or Meta Ads better for small business?
Neither wins universally — it depends on your industry and what triggers a purchase. Need-driven categories like healthcare and legal services convert better on Google (Physicians & Surgeons: 12.43% vs. 4.51%); visually-driven categories like restaurants and real estate convert better on Meta (Restaurants & Food: 18.25% vs. 8.05%).1,2
Should I trust Meta's reported ROAS on Advantage+ campaigns?
Treat it as directionally useful but incomplete. Meta reports $4.52 average ROAS, but independent research across 640 incrementality experiments found Advantage+ underperformed manual campaigns on true incremental lift for the majority of brands studied, and a separate analysis found new-customer acquisition cost doubling even while reported ROAS held flat.4,5,7 The dashboard number and the real business impact aren't always the same thing.
Can a small business run both Google Ads and Meta Ads at once?
Yes, and for many businesses it's the stronger approach — using Meta to build awareness among people who don't yet know they want your product, then Google Ads to capture the search demand that awareness eventually creates. 56% of small businesses currently run social ads and 45% run search ads, and many run both.6
Key Takeaways
The platform that "wins" depends on where your customer sits between actively searching and being shown something new — not on which platform reports the lower cost per lead or the higher ROAS on its own dashboard. Use the industry data above to place your business on that spectrum, and treat any single platform's self-reported return with some healthy skepticism. For the cost side of this comparison, see cost-per-lead benchmarks by industry, and once you've picked a platform, make sure the landing page you're sending that traffic to is actually built to convert it. See the full lead generation playbook for how paid media fits into your overall strategy, or talk to a growth strategist for a media buying plan built around your actual customers.
Want more like this in your inbox?
Occasional, practical marketing advice for local service businesses. No spam.
References (9)
- 1.WordStream/LocaliQ — 2026 Google Ads Benchmarks, published May 19, 2026, n=13,474 US search campaigns
- 2.WordStream/LocaliQ — Facebook Ads Benchmarks 2025, published September 15, 2025, n=726 US lead campaigns
- 3.eMarketer — Meta to Surpass Google in Digital Ad Revenues for First Time Ever, published April 13, 2026
- 4.Meta for Business — Advantage+ Shopping product page (self-reported performance data)
- 5.Haus.io — The Meta Report: Lessons from 640 Incrementality Experiments, published July 28, 2025
- 6.LocaliQ — Small Business Marketing Trends Report 2026, published February 24, 2026
- 7.Wicked Reports — Analysis of 55,661 Meta campaigns, published June 10, 2025
- 8.Groas — Proprietary account analysis, 247 accounts, ~18 months, published November 17, 2025
- 9.CNBC — Reporting on Meta's Q4 2021 earnings call, published February 2, 2022

Written by
Yash · Creative Specialist
Builds the creative and content that gets your business noticed.